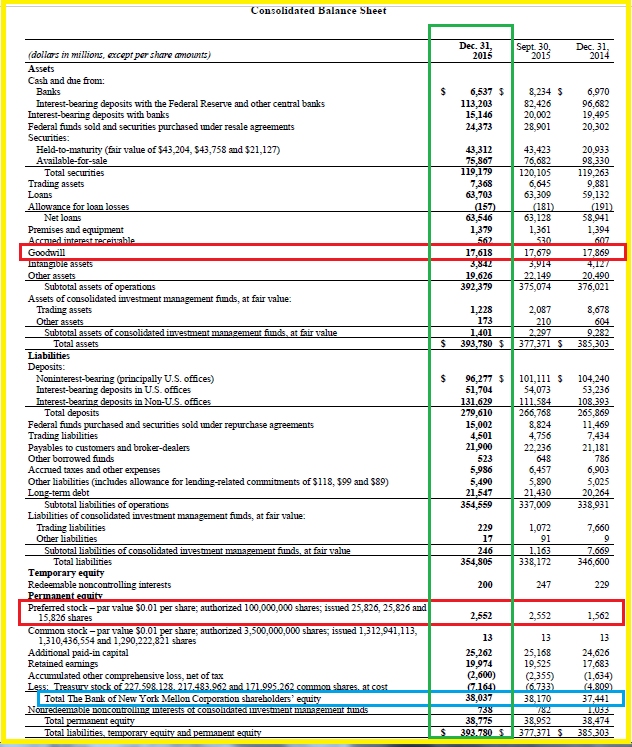
State Street, bien qu’ayant un total de son bilan relativement modeste pour les Etats-Unis, est l’une des 8 banques à risque systémique retenue par la BRI pour ce pays.
Elle ne respecte pas les règles prudentielles d’endettement de ce bon vieux Greenspan avec un leverage réel de 21,7 largement supérieur à la norme (en nette détérioration par rapport au trimestre précédent) correspondant à un véritable ratio Core Tier 1 réel de 4,6 %,
Document 1 :
| State Street | 2014 Q4 | 2015 Q1 | 2015 Q2 | 2015 Q3 | 2015 Q4 |
|---|---|---|---|---|---|
| 1 Assets | 274,119 | 279,476 | 294,571 | 247,274 | 279,476 |
| 2 Equity | 21,473 | 20,819 | 21,5 | 21,5 | 20,67 |
| 3 Preferred st | 1,47 | 1,47 | 2,212 | 2,703 | 2,703 |
| 4 Goodwill | 5,826 | 5,663 | 5,729 | 5,716 | 5,663 |
| 5 Tangible eq | 14,177 | 13,686 | 13,559 | 13,081 | 12,304 |
| 6 Liabilities | 259,942 | 265,79 | 281,012 | 234,193 | 267,172 |
| 7 Leverage (µ) | 18,3 | 19,4 | 20,7 | 17,9 | 21,7 |
| 8 Core Tier 1 (%) | 5,5 | 5,1 | 4,8 | 5,6 | 4,6 |
Sommes en milliards de dollars.
Les capitaux propres de State Street baissent alors que le total des dettes augmente nettement, de 33 milliards de dollars par rapport au trimestre précédent, ce qui est exactement ce qu’il ne faut pas faire !
State Street est la pire des 8 grandes banques américaines à risque systémique.
Il faudrait augmenter le montant des capitaux propres de 13 milliards de dollars ou diminuer le total des dettes de 144 milliards pour respecter les règles prudentielles d’endettement de ce bon vieux Greenspan, à savoir un leverage inférieur à 10.
Document 2 :

Malgré ces mauvais fondamentaux et la baisse récente de son cours, la capitalisation boursière de State Street de 21 milliards de dollars est largement supérieure à ses actifs tangibles, ce qui montre que les marchés ne sont pas inquiets pour cette banque.
Cliquer ici pour voir le bilan de cette banque pour ce dernier trimestre.

Connaissez vous la nouvelle « banque »NUMBER 26 (wirebank) allemande?
Elle paraît très intéressante.
Finalement Milton Friedman applique la loi biblique du Lévitique de la rémission des dettes pour les particuliers..
Problème, il n’annule pas la dette globale… juste un transfert…
Now, however, there is an old/new idea making the rounds: “Helicopter money”. Nobel Prize winning economist Milton Friedman first coined the phrase back in 1969, positing that you could drop money from the sky to increase inflation as the lucky recipients of the newfound wealth spent their windfall. And in a seeming proof of the laws of fashion – everything old is eventually new again – the topic of helicopter money is as hot a pair of vintage Chanel sunglasses or beaten up 1950s motorcycle jacket. No less a figure than Ray Dalio of Bridgewater has been talking about it in a recent note to clients, and a Google news search for the topic returns over 7 million items.
But does it work? We refer readers to a recent paper by Willem Buiter, entitled “The Simple Analytics of Helicopter Money: Why it Works – Always”. Fair warning: there are pages of the paper that look like the windows of Russell Crowe’s room in “A Beautiful Mind”, full of Greek letters and formulas.
Thankfully, we have two excellent case studies of actual “Helicopter money” in the U.S. in the last 15 years so we don’t need to rely on economic theory alone to answer the question. The first was in 2001, when as part of an overhaul of the tax code the U.S. Treasury mailed $300-$600 checks to about two thirds of all U.S. households. The second “Drop” came in 2008, with checks going out to essentially the same proportion of households for an average of $950. Both were technically refund/rebate checks meant to stimulate the U.S. economy.
A 2004 paper form the National Bureau of Economic Research summarized the results of the 2001 “Helicopter money” this way:
Recipients spent, on average, 53-73% of their checks.
The spending took place over two quarters, with households spending 20-40% in the first period and roughly another third in the second.
Consumers spent on average an incremental $51 on food and $179 on non-durable goods in the first quarter after receiving the money.
The authors found that lower income households spent more of their refund than wealthier ones.
All data came from surveys of recipients as they received their checks and through the next 2 quarters.
A similarly structured survey in the wake of the 2008 money drop found very different results:
Only one fifth of survey respondents reported that the 2008 tax rebates would lead them to increase spending.
Almost half said they would use the money to pay down debt.
The remainder reported that they would save the cash.
So what’s the difference between the two experiences? The 2008 Great Recession was the hangover from the housing crisis, and many Americans were watching their home equity disappear even as they had mortgage payments to make. Unemployment was on the rise, and financial markets were in turmoil. Conversely the 2001 experience, which occurred before the terrorist attacks of September 11th, was a more garden-variety recession combined with a notable (but in the end manageable) bursting of the dot com bubble in 2000.
You can see the difference in the reported Personal Savings Rate as well. In 2001, it stood at 3-5%. By 2008, it was spiking to 8.0%. Naturally, a “Helicopter Drop” will be more efficient in the former environment than the latter. As a point of reference, savings rates are on the rise in the last year and stand at 5.5% right now.
The upshot of this comparison is straightforward: “Helicopter money” works, but less so in a crisis situation. The tax refunds of 2001 were, in fact, mostly spent by their recipients. Just seven years later when the same households got an even larger money drop, they reported saving most of the cash. So if central bankers think that this approach might be an option to combat deflationary pressures and sluggish economies, the right time to launch the choppers is before consumers realize they need them.