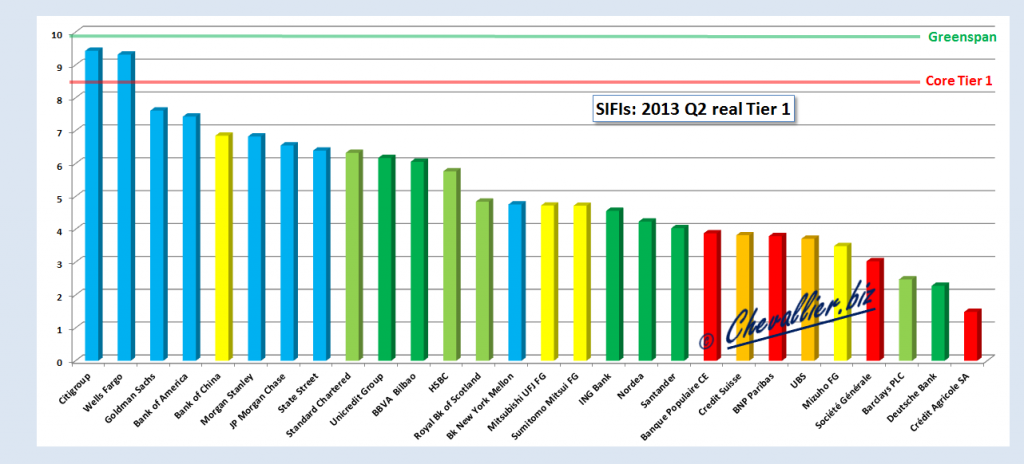
Like all companies, banks finance their assets by equity and liabilities. Alan Grenspan enacted in the 80’s Tier 1 ratio Rule for the banking system: the amount of capital must be greater than 8% of the total debt, its inverse is the leverage to be less than 12.5.
After the financial turmoil he increased this ratio to 10%, i.e. a leverage of up to 10.
After the bursting of the Internet bubble, Alan Grenspan dictated to companies to recognize any goodwill in losses and in full instead of amortizing it over 20 years, which restored fundamentals and GDP growth.
These two rules must be applied to determine the current real leverage of real capital: tangible assets (excluding minority interests).
Table of real leverage ratio and Tier 1 for 28 Systemically Important Financial Institutions (SIFIs),
Document 1:
| Rank | Banks 2013 Q2 | Liabilities | Tangible equity | Leverage | Core Tier 1 |
|---|---|---|---|---|---|
| 1 | Citigroup | 1 721,61 | 162,382 | 10,6 | 9,4 |
| 2 | Wells Fargo | 1 317,77 | 122,796 | 10,7 | 9,3 |
| 3 | Goldman Sachs | 871,651 | 66,349 | 13,1 | 7,6 |
| 4 | Bank of America | 1 976,46 | 146,861 | 13,5 | 7,4 |
| 5 | Bank of China | 12 406,23 | 849,978 | 14,6 | 6,9 |
| 6 | Morgan Stanley | 754,178 | 146,861 | 14,7 | 6,8 |
| 7 | JP Morgan Chase | 2 289,77 | 149,977 | 15,3 | 6,5 |
| 8 | State Street | 213,633 | 13,667 | 15,6 | 6,4 |
| 9 | Standard Chartered | 611,289 | 38,668 | 15,8 | 6,3 |
| 10 | Unicredit Group | 837,918 | 51,714 | 16,2 | 6,2 |
| 11 | BBVA Bilbao | 583,177 | 35,326 | 16,5 | 6,1 |
| 12 | HSBC | 2 501,10 | 144,217 | 17,3 | 5,8 |
| 13 | Royal Bk of Scotland | 1 160,05 | 56,183 | 20,6 | 4,84 |
| 14 | Bk New York Mellon | 343,486 | 16,336 | 21 | 4,76 |
| 15 | Mitsubishi UFJ FG | 223 921 | 10 578 | 21,2 | 4,724 |
| 16 | Sumitomo Mitsui FG | 140 069 | 6 608 | 21,2 | 4,718 |
| 17 | ING Bank | 1 093,72 | 49,881 | 21,9 | 4,6 |
| 18 | Nordea | 596,629 | 25,267 | 23,6 | 4,2 |
| 19 | Santander | 1 175,70 | 47,421 | 24,79 | 4 |
| 20 | Banque Populaire CE | 1 647,67 | 63,923 | 25,8 | 3,9 |
| 21 | Credit Suisse | 886,055 | 33,848 | 26,2 | 3,82 |
| 22 | BNP Paribas | 1 837,63 | 69,657 | 26,4 | 3,79 |
| 23 | UBS | 1 088,65 | 40,426 | 26,9 | 3,7 |
| 24 | Mizuho FG | 168 803,10 | 5 889,71 | 28,7 | 3,5 |
| 25 | Société Générale | 1 209,68 | 36,618 | 33 | 3 |
| 26 | Barclays PLC | 1 495,70 | 37,034 | 40,4 | 2,5 |
| 27 | Deutsche Bank | 1 867,29 | 42,592 | 43,8 | 2,3 |
| 28 | Crédit Agricole SA | 1 758,74 | 26,164 | 67,2 | 1,5 |
None of these major banks respects the rules of a real Tier 1 ratio above 10% but U.S. banks are those that are closest, Citigroup and Wells Fargo are the most reliable,
Document 2:

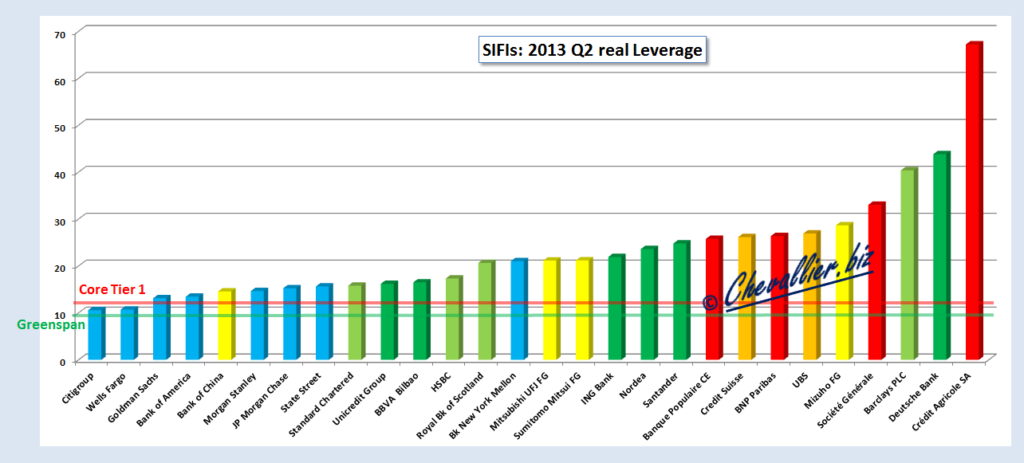
Banks in the United States in blue, French Gos banks in red, Switzerland’s banks in orange, banks under Bank Of England in light green, other European bank in dark green s, Asian banks in… yellow.
The graph shows that European banks leverage is the most dangerous, especially Crédit Agricole (CASA) and Deutsche Bank,
Document 3:

Major European banks do not follow the rules of prudential borrowing. The interbank market in the euro zone does not work. The ECB has to replace the market to avoid a banking tsunami that threatens the world.

« Quite simple ! »
Bien Mr Chevallier tous azimuts et tous languages , tapez sur ces banks , ce sont leurs collègues qui vont faire le ménage.
Cher Mr Chevallier,
Avez-vous compile vous meme les donnees, ou les avez vous trouvees ailleurs.
Au quel cas, pourriez vous m’indiquer vos sources.
(C’est pour un article scientifique, mais je ne suis pas economiste et un peu perdu.)
Merci
Beau travail, cela remet un peu de clarté dans cette atmosphère trouble, dont les petits feront les frais.
Petite remarque n’avez-vous pas une erreur dans les chiffres concernant Morgan Stanley ?
Ma banquière refute ces chiffres et vous demande de vous mettre à jour sur les derniers chiffre.
SG
TROISIEME TRIMESTRE 2013 : PERFORMANCE SOLIDE DU GROUPE
? Ratio Core Tier 1 Bâle 3 de 9,9%
? PNB de 5,7 Md EUR, +14,3%* /T3-12,
Progression de 3,8%* des revenus des métiers /T3-12, contribution équilibrée des trois
piliers
? Avancée significative du plan de réduction de coûts : 260 M EUR d’économies
sécurisées pour des coûts de transformation non-récurrents de -170 M EUR
? Coût net du risque (1) stable à 69 points de base
? Résultat net part du Groupe comptable de 534 M EUR, multiplié par 6 /T3-12
Résultat net part du Groupe** de 976 M EUR, (+14,3%/ T3-12)
ROE** de 8,5% au T3-13
? Entrée en négociations exclusives pour le rachat de Newedge, poursuite du recentrage
des métiers
9M-13 : RÉSULTAT NET PART DU GROUPE** DE 2 934 M EUR (+4,3% /9M-12),
PROGRESSION DU RBE DES MÉTIERS +10,5%* /9M-12
? Résultat net part du Groupe comptable de 1,9 Md EUR (1,3 Md EUR aux 9M-12)
? Coefficient d’exploitation** stable /9M-12
? ROE** de 8,6% aux 9M-13
BNPA (2) : 2,12 EUR
pour le CA
http://www.credit-agricole.com/Investisseur-et-actionnaire/Communiques-de-presse/Resultats-du-3e-trimestre-et-des-9-premiers-mois-2013
Vous en pensez quoi ?
bonjour,vous ne parlez pas des banques irlandaise comme AIB BANQUE IRLANSE ET LA PETITE PSB QUI EST 99% détenue par l état QUE PENSEZ_VOUS
J’ai un doute sur les chiffres de Mizuho FG (pb de devises?), mais ça ne doit pas changer le leverage et CT1.
Conseils très utiles ! A mettre en pratique maintenant !
Bank of China !!! that’s hilarious.