After the long period of disinflation during the 1980s and 1990s and during this crisis in the euro area, what should be the normal structure of rates?
The answer is simple…
When Alan Greenspan chaired the Fed, he considered that inflation should fluctuate in a range of 1.0% to 1.5%, he reached this goal in 1998.
Document 1:
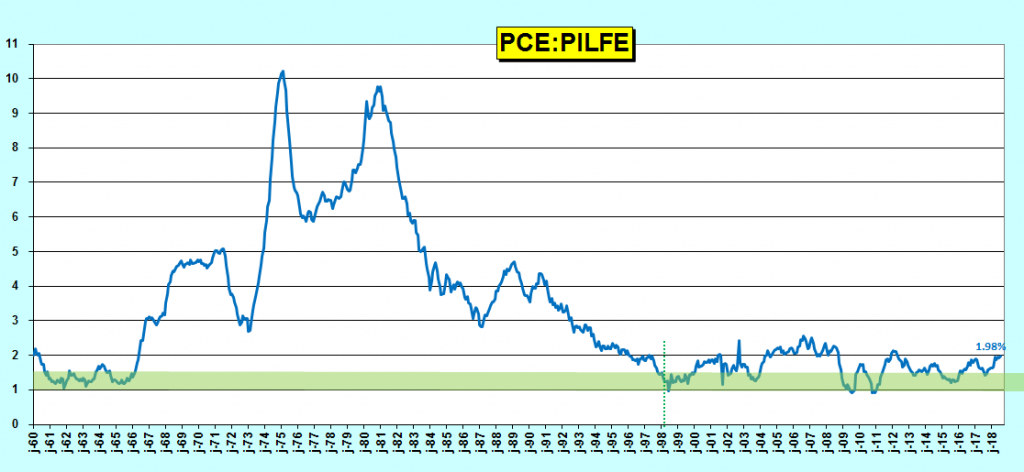
Indeed, the significant risk was then the return to inflation which had to remain at a very low level: less than 1.5%.
As there was almost no risk of deflation, the inflation floor was equal to 1.0%, which was considered the lowest level of interest rates.
After the Great Recession, American’s behavior changed: even with a very low unemployment rate, and therefore full employment (there were even labor shortages), wages did not increase as it was the case in the 1960s.
In that situation, the FOMC members have raised the optimal level of inflation by 2.0% because the risks of deflation are conceivable.
This level of inflation is now reached,
Document 2:
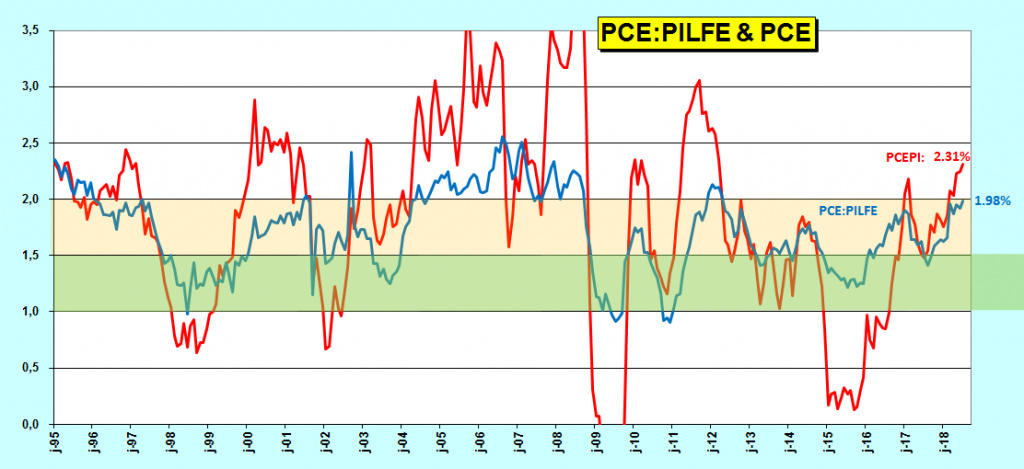
Alan Greenspan used the non-volatile index PCE:PILFE as a measure of inflation, but Americans are subject to inflation on all of the PCEPI prices, which are currently in the range of 2%,
Jay Powell is pragmatic: he does not analyze the economic situation according to specific models.
For him, several elements must be taken into consideration.
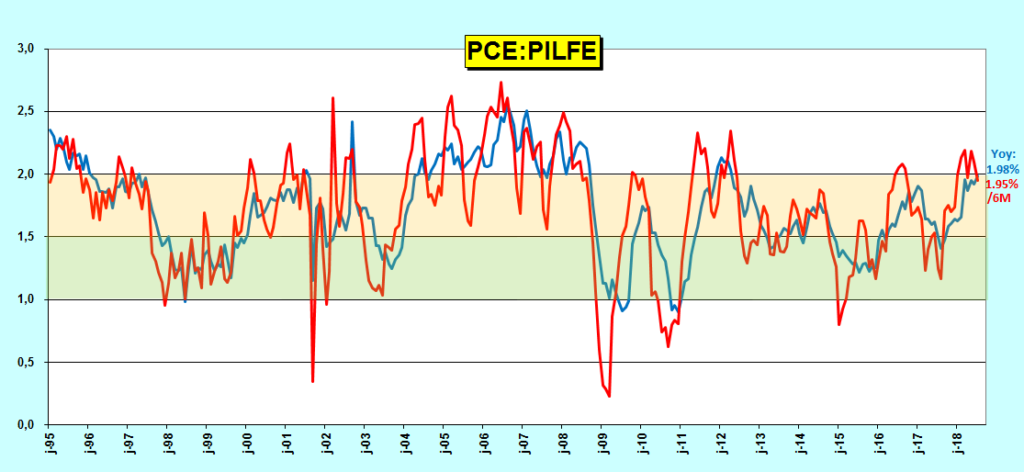
For example, the inflation calculated over the last 6 months according to the PCE:PILFE is less than 2% (annualized), which means that the price increase is slowing down and that the rate of the Fed can gradually return to the standard,
Document 3:
Thus, with average inflation around 2.0%, the Fed’s basic rate corresponding to short-term rates should be slightly higher than this inflation rate: 2.5%.
The normal yields of the 2-year Treasury Notes pegged at the Fed’s rate with an average spread of 50 basis points should be equal to 3.0%.
The difference between the 10-year Treasury Notes and the 2-Year Treasury Notes, the so-called 10y-2y Yield spread should fluctuate in a range of 1.0 to 1.5 points, and yields of 10-year Treasury Notes should, therefore, vary between 4.0% to 4.5%.
This rate structure makes sense.
In the absence of a crisis in the euro area, this rate structure should have moved towards these values after the Great Recession,
Document 4:
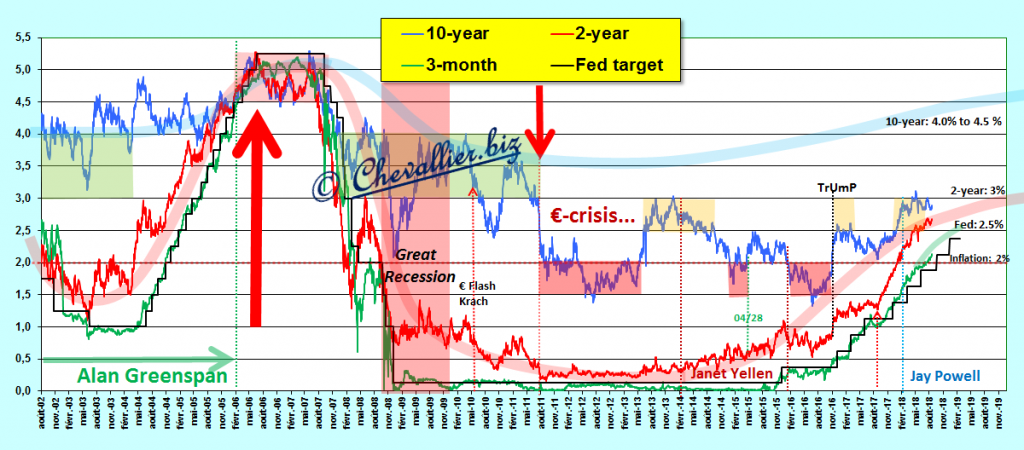
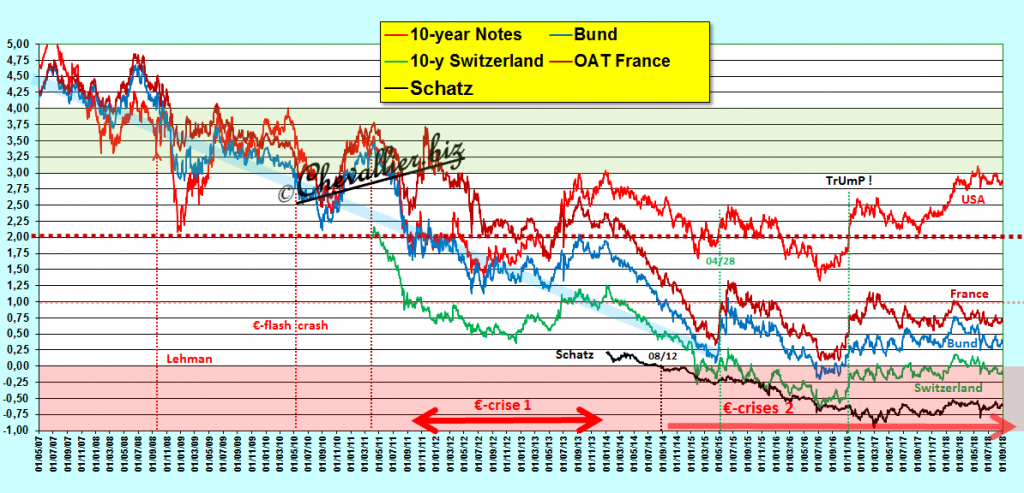
It is quite evident that it is the crisis in the euro area that has dropped the yields of the Treasury Notes from July 2011.
This structure of rates highlighted in those of the United States is a standard that exists logically elsewhere in the world.
Treasury yields of less than 2% correspond to extraordinary situations corresponding to deep and dangerous dysfunctions, as is the case in the old continental Europe,
Document 5:
Furthermore, the FOMC members define ranges of fluctuation on levels for the Fed’s base rate.
An interesting innovation would be to set a slope of this range of fluctuation corresponding to the anticipation of the evolution of their monetary policy,
Document 6:
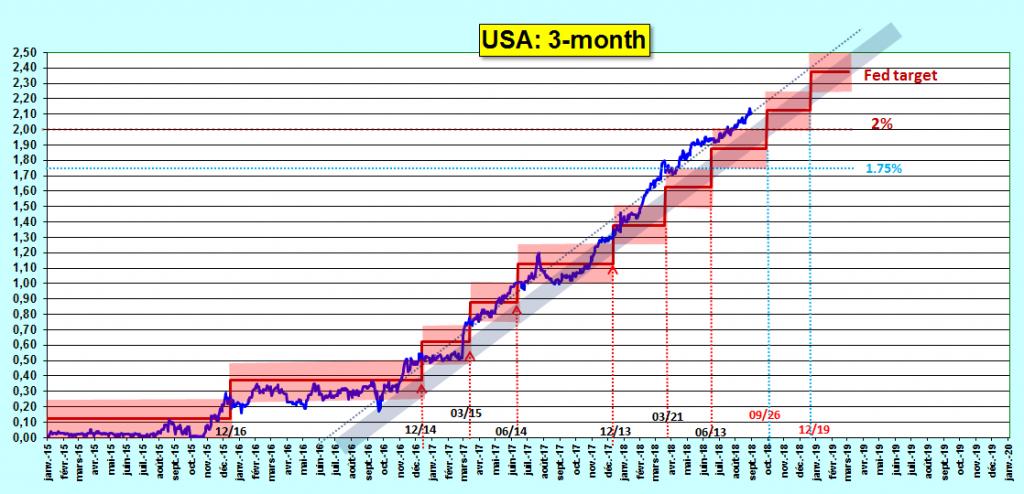
The markets follow this trend naturally and spontaneously with the yields of the Bill at 3 months.
Everything is simple.
Jean-Pierre, ne le prenez pas mal, mais si vous souhaitez être crédible auprès de lecteurs UK ou US il vous faut un traducteur qualifié. Actuellement il s’agit d’une translation word by word done by you, ce qui ruine le fond, ce qui est fort dommage.
Deepl.com fait des merveilles…un début.
Bonsoir,
Vu dans le Parisien,le 3/09, en bref..
« Le directeur général de l’une des plus vieilles banques Britaniques, la RBS, à déclaré hier se préparer au pire sur fond de craintes grandissantes des conséquences économiques d’une absence d’accord dans les négociations sur le Brexit. »
Merci, bonne soirée.
BS scénaristique pour effrayer la population et la ramener dans le carcan européiste.